Is the crop growing well?
Measures how thick and vigorous the green canopy is from one end of the field to the other.
- NDVI
- SAVI
- RVI
Best used: NDVI all season long; SAVI in the early weeks, while bare soil still shows between the rows.
Satellite Intelligence
We run the imagery through our own algorithms in-house. The results appear in the app and on the web dashboard, and the main indices are also available through the API.
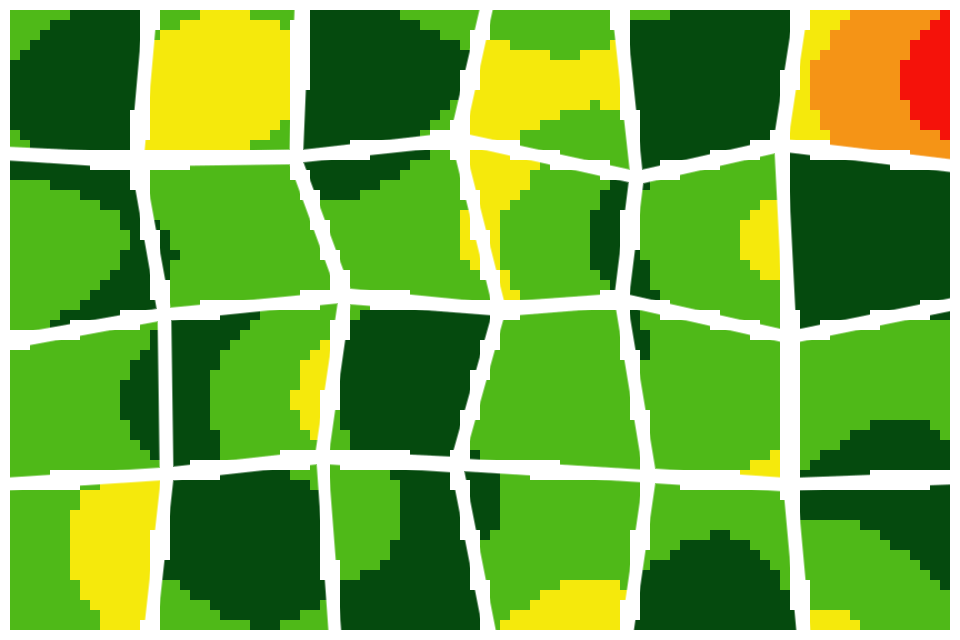
Illustrative example.
What you get
Each update is drawn around your own boundary, so the map reads at a glance instead of needing to be decoded.
Only your land appears on the map. Neighbouring plots and roads are left out.
Severe, High, Moderate, Healthy and Very healthy. A single colour scale shows where to look first.
Know how much of the field is affected, not only where.
Set this week beside last week and catch a slow decline long before it shows from the field edge.
Indices, explained simply
Behind each question sits a set of indices. You start from the question; we take care of the maths.
Measures how thick and vigorous the green canopy is from one end of the field to the other.
Best used: NDVI all season long; SAVI in the early weeks, while bare soil still shows between the rows.
Follows leaf chlorophyll, which drops when the crop runs short of nitrogen.
Best used: ahead of a top-dressing or fertigation call, and after the canopy closes.
Detects how much water the plants and their leaves are holding.
Best used: during dry spells, to see which blocks dry out first.
Maps moisture over the entire field, including the spots one probe would never reach.
Best used: to irrigate zone by zone and to find corners that get too much water.
How we process it
Five steps, every one of them run by Qtonet.
We pick the most recent cloud-free pass over your farm.
The scene is trimmed to the edge of your farm.
Our own algorithms compute each index.
Values are grouped into five stress levels on our colour scales.
Where a farm has a station, results are compared with its soil-moisture and weather readings.
All done in-house.
Sample maps
Three examples of how stress levels appear in the field.
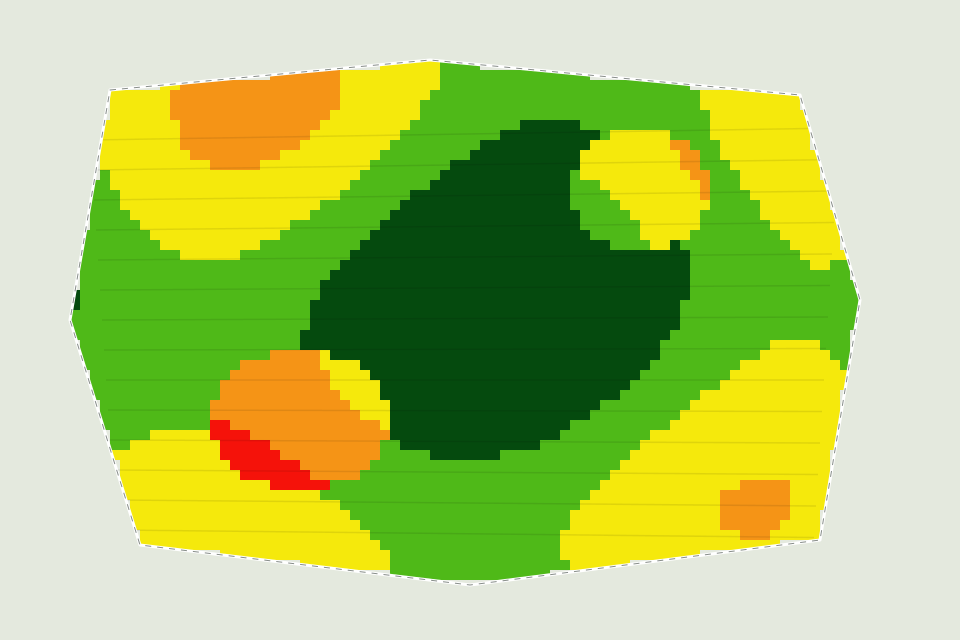
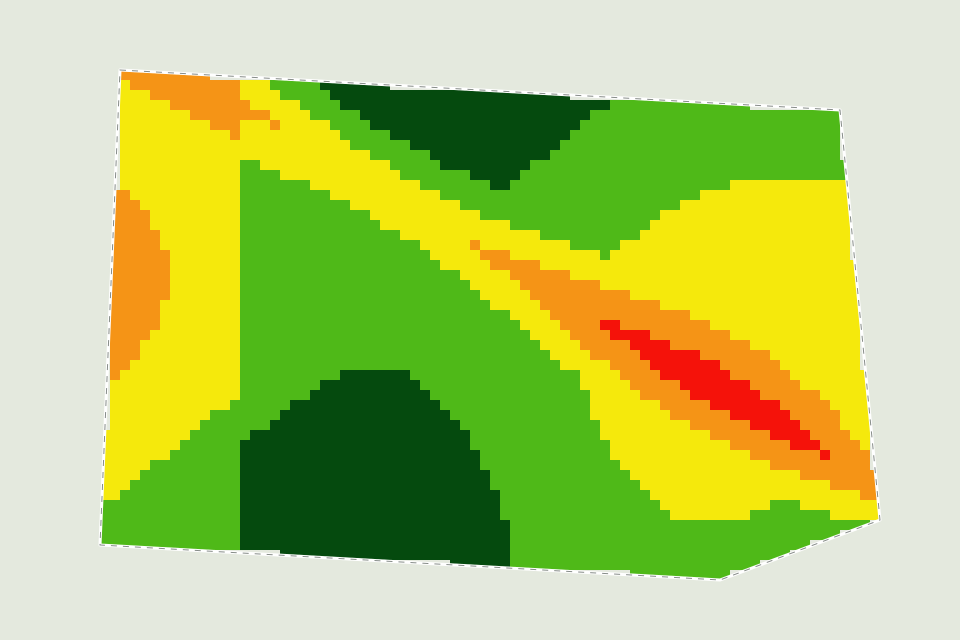
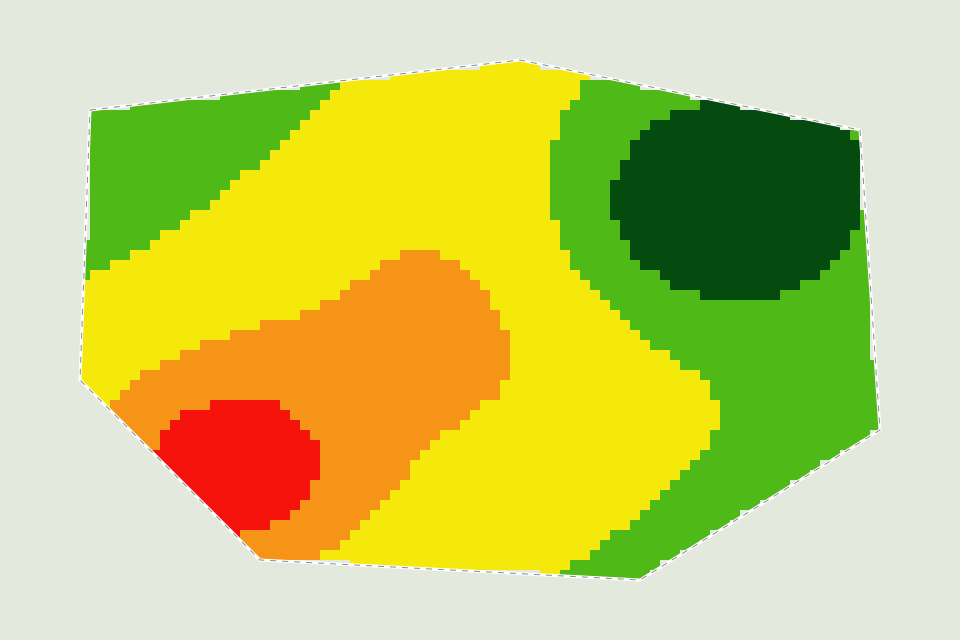
In the demo we show you real maps.
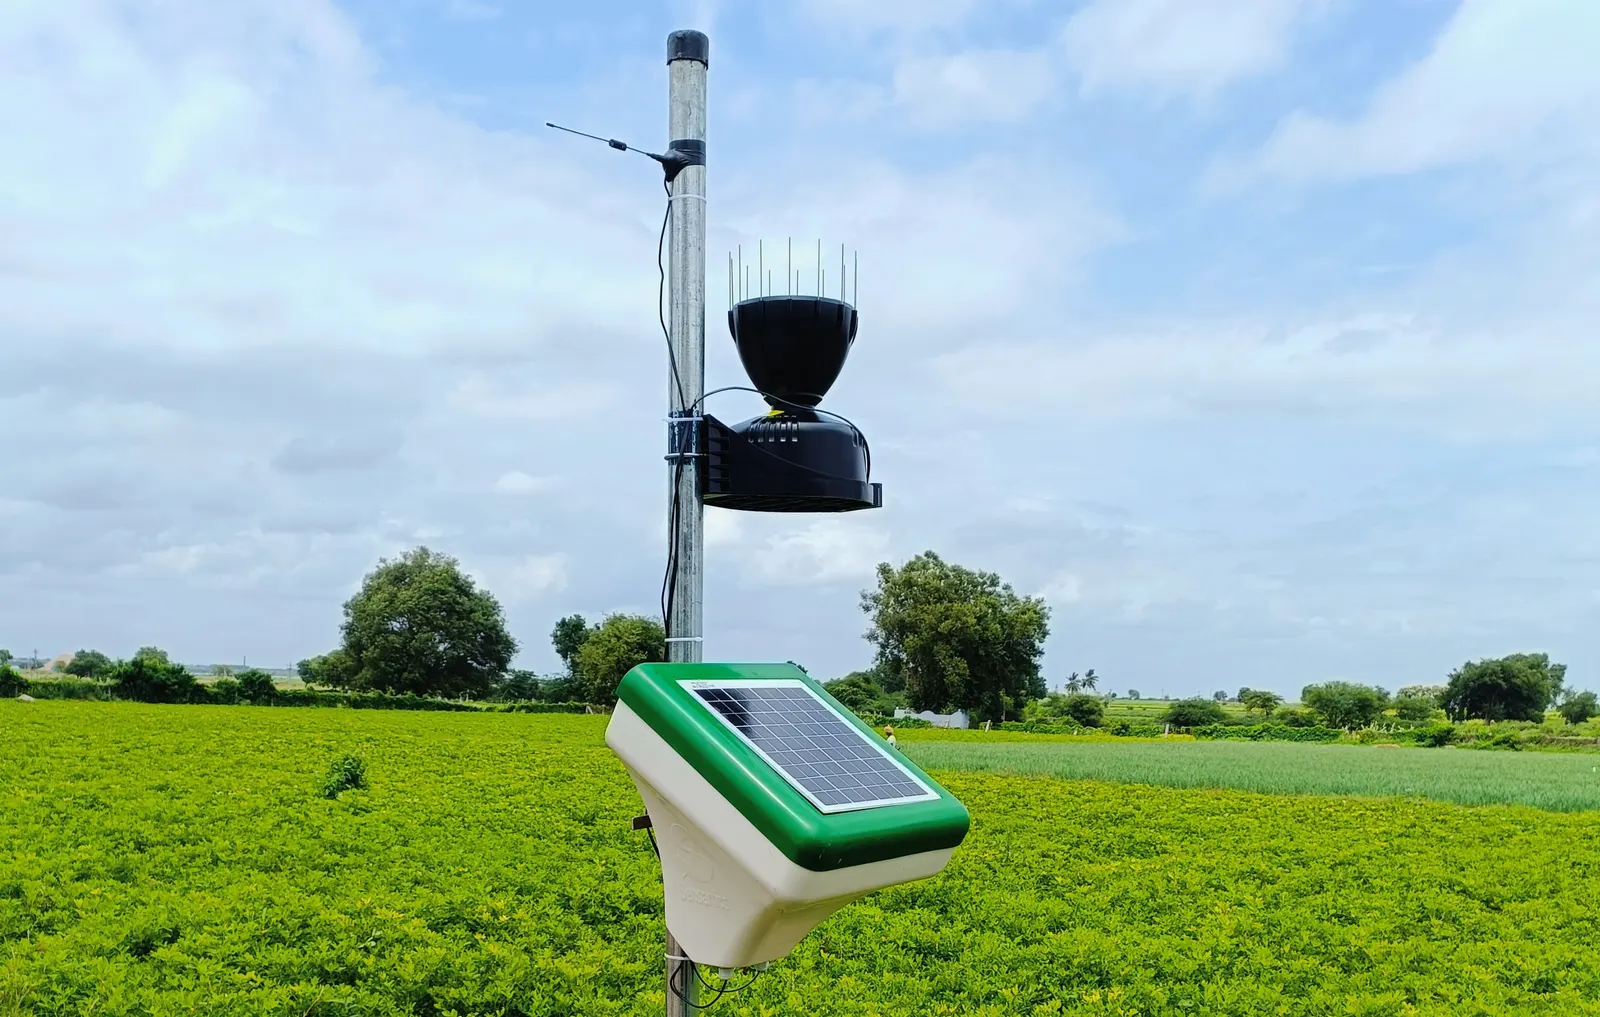
Stronger together
The map tells you where the trouble is. The station tells you why and when: a dry week, a cold night or hours of wet leaves.
On farms with a station, we test every satellite result against its ground readings.
Questions
Once a week for every farm we monitor.
The map refreshes on the next clear pass. Field stations keep logging through the clouds, so ground readings never stop.
Yes. Satellite monitoring stands on its own. Where a farm also has a station, we use it to cross-check the map.
Grapes, Pomegranate, Onion, Tomato, Sugarcane, Vegetables, and many more. Ask us about yours.
In the mobile app and the web dashboard. The main indices can also be pulled through the Data API.
Ask us for a quote. Pricing scales with the number of farms and the area you want covered.
Book a demo and we will take you through real maps.